Note
Go to the end to download the full example code.
Lay-up properties#
This example shows how to efficiently extract elemental lay-up properties such as thickness, angles, and analysis ply names. These are typically used for layer-wise postprocessing and data filtering.
To get the full layer information of an element, including results,
consider using the SamplingPoint class.
Note
When using a Workbench project,
use the composite_files_from_workbench_harmonic_analysis()
method to obtain the input files.
Set up analysis#
Setting up the analysis consists of importing dependencies, connecting to the DPF server, and retrieving the example files.
Import dependencies.
from matplotlib import pyplot as plt
import numpy as np

from ansys.dpf.composites.composite_model import CompositeModel, LayerProperty
from ansys.dpf.composites.example_helper import get_continuous_fiber_example_files
from ansys.dpf.composites.server_helpers import connect_to_or_start_server
Start a DPF server and copy the example files into the current working directory.
Set up model#
Set up the composite model.
composite_model = CompositeModel(composite_files_on_server, server)
Get lay-up properties#
Get lay-up properties for all elements and show the first one as an example.
element_id = 1
thicknesses = composite_model.get_property_for_all_layers(LayerProperty.THICKNESSES, element_id)
angles = composite_model.get_property_for_all_layers(LayerProperty.ANGLES, element_id)
shear_angles = composite_model.get_property_for_all_layers(LayerProperty.SHEAR_ANGLES, element_id)
offset = composite_model.get_element_laminate_offset(element_id)
analysis_plies = composite_model.get_analysis_plies(element_id)
print(analysis_plies)
['P1L1__woven_45', 'P1L1__ud_patch ns1', 'P1L1__ud', 'P1L1__core', 'P1L1__ud.2', 'P1L1__woven_45.2']
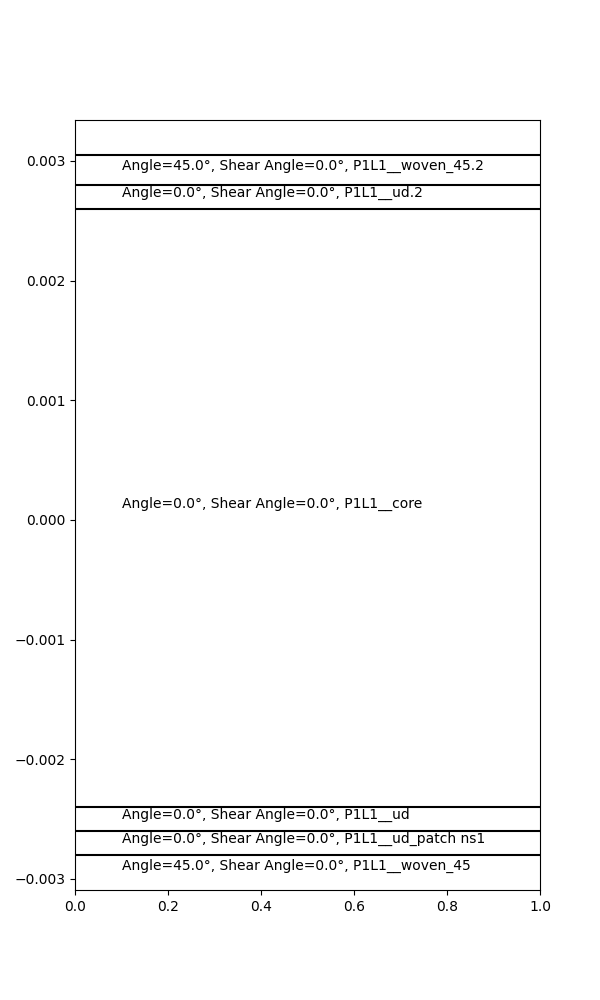
Plot lay-up properties#
Plot basic layer properties (layer thicknesses, angles, and analysis ply names).
import matplotlib.pyplot as plt

y_coordinates = offset + np.cumsum(thicknesses)
y_centers = y_coordinates - thicknesses / 2

fig, ax1 = f, ax = plt.subplots(figsize=(6, 10))

for y_coordinate in y_coordinates:
    ax1.axhline(y=y_coordinate, color="k")

for angle, shear_angle, y_center, analysis_ply in zip(
    angles, shear_angles, y_centers, analysis_plies
):
    ax1.annotate(
        f"Angle={angle}°, Shear Angle={shear_angle}°, {analysis_ply}",
        xy=(0.1, y_center),
        xytext=(0.1, y_center),
        va="center",
    )
ax1.set_ylim(offset, max(y_coordinates))

plt.show()

Total running time of the script: (0 minutes 5.085 seconds)

