Note
Go to the end to download the full example code.
Sampling point#
This example extracts ply-wise laminate properties and results.
The Sampling Point class is used to extract
through-the-thickness data of the laminate, such as ply-wise properties,
strains and stresses. It then implements basic visualization to plot
the laminate.
This example uses the Composite Model to scope a
Sampling Point to a certain element and to visualize the laminate.
Note
When using a Workbench project,
use the get_composite_files_from_workbench_result_folder()
method to obtain the input files.
Set up analysis#
Setting up the analysis consists of loading Ansys libraries, connecting to the DPF server, and retrieving the example files.
Load Ansys libraries.
from ansys.dpf.composites.composite_model import CompositeModel
from ansys.dpf.composites.constants import Spot
from ansys.dpf.composites.example_helper import get_continuous_fiber_example_files
from ansys.dpf.composites.failure_criteria import (
    CombinedFailureCriterion,
    CoreFailureCriterion,
    MaxStrainCriterion,
    MaxStressCriterion,
    VonMisesCriterion,
)
from ansys.dpf.composites.server_helpers import connect_to_or_start_server
Start a DPF server and copy the example files into the current working directory.
Configure the combined failure criterion
combined_fc = CombinedFailureCriterion(
    name="failure of all materials",
    failure_criteria=[
        MaxStrainCriterion(),
        MaxStressCriterion(),
        CoreFailureCriterion(),
        VonMisesCriterion(vme=True, vms=False),
    ],
)
Set up model and create sampling point#
Set up the composite model.
composite_model = CompositeModel(composite_files_on_server, server)
Create a sampling point
sampling_point = composite_model.get_sampling_point(combined_criterion=combined_fc, element_id=3)
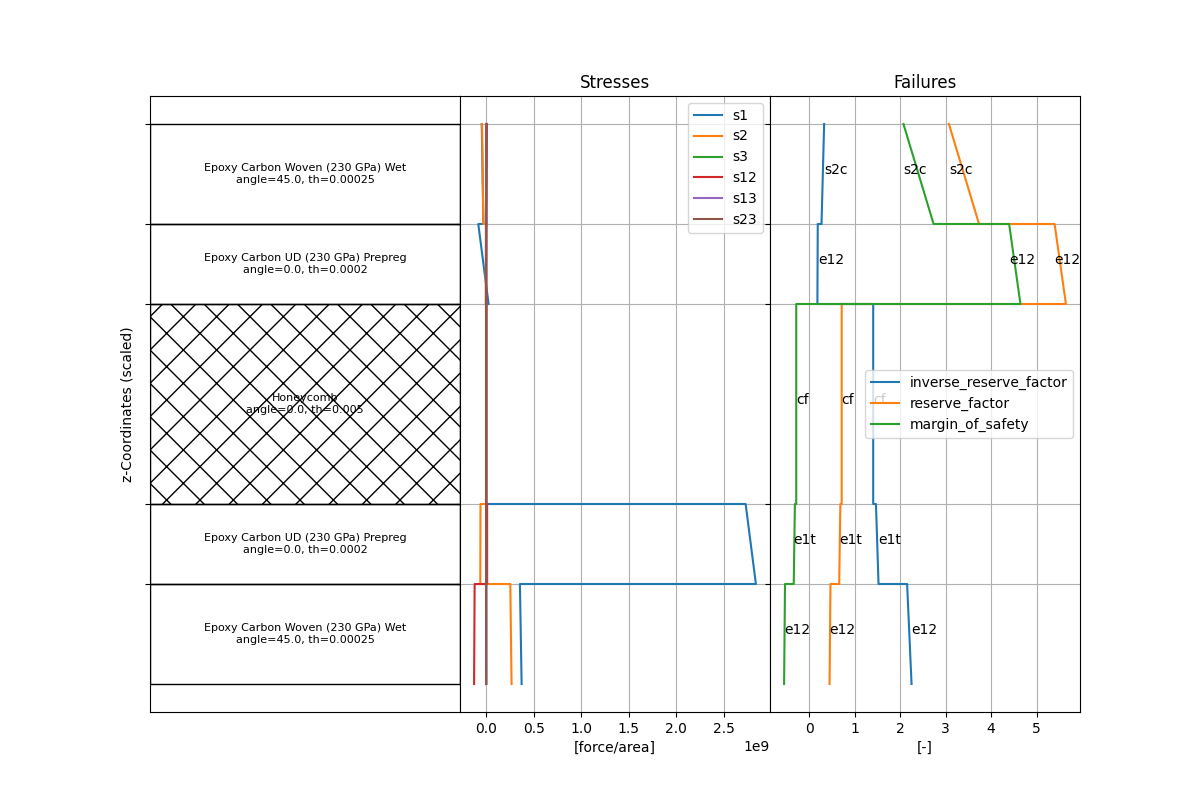
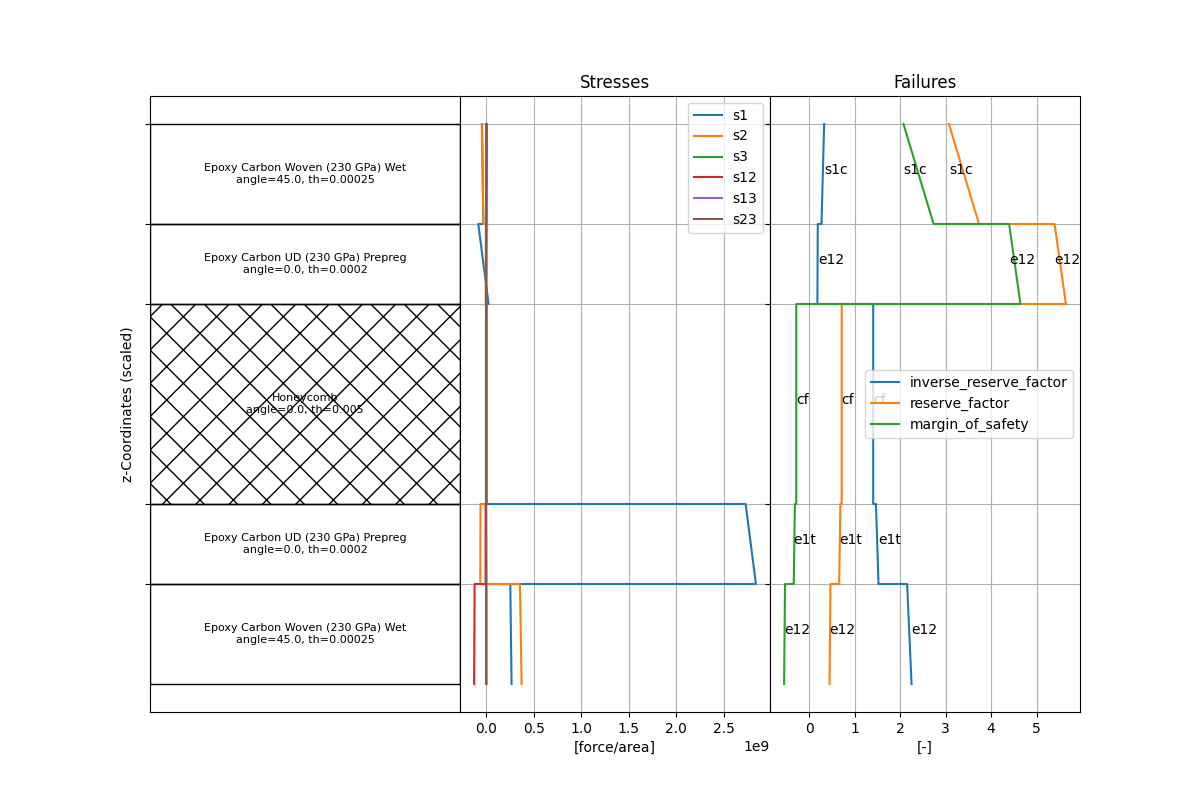
Plot results#
Plot results uing preconfigured plots. For more information, see the
SamplingPoint.get_result_plots() method.
sampling_point_plot = sampling_point.get_result_plots(
    strain_components=[],  # do not plot strains
    core_scale_factor=0.1,
    spots=[Spot.BOTTOM, Spot.TOP],
    show_failure_modes=True,
)
sampling_point_plot.figure.set_figheight(8)
sampling_point_plot.figure.set_figwidth(12)
sampling_point_plot.figure.show()
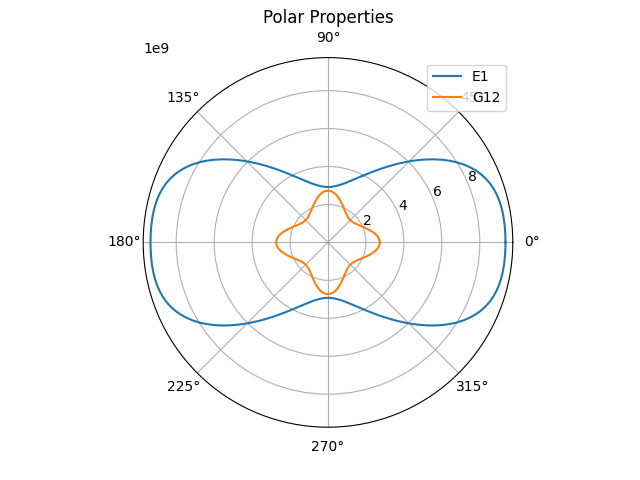
Plot polar properties.
sampling_point_plot = sampling_point.get_polar_plot(["E1", "G12"])
sampling_point_plot.figure.show()
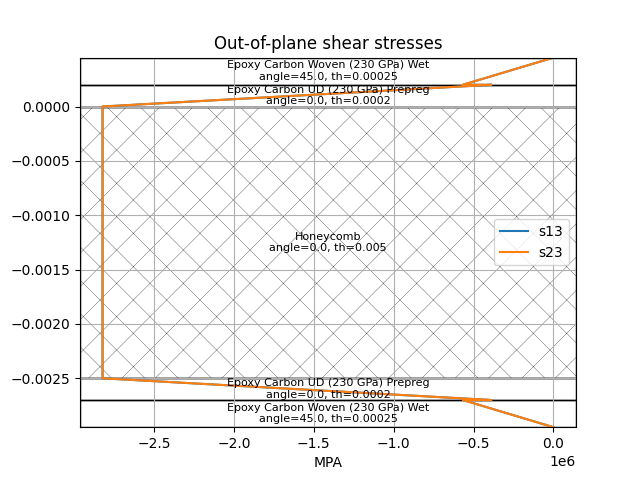
Generate custom plots. You can customize existing plots or build
them from scratch using a package like Matplot or Plotly. This code
uses Matplotlib to generate a custom plot of results s13 and s23.
import matplotlib.pyplot as plt

fig, ax1 = plt.subplots()
core_scale_factor = 0.5

sampling_point.add_results_to_plot(
    ax1,
    ["s13", "s23"],
    [Spot.BOTTOM, Spot.TOP],
    core_scale_factor,
    "Out-of-plane shear stresses",
    "MPA",
)
ax1.legend()
plt.rcParams["hatch.linewidth"] = 0.2
plt.rcParams["hatch.color"] = "silver"
sampling_point.add_ply_sequence_to_plot(ax1, core_scale_factor)
fig.show()
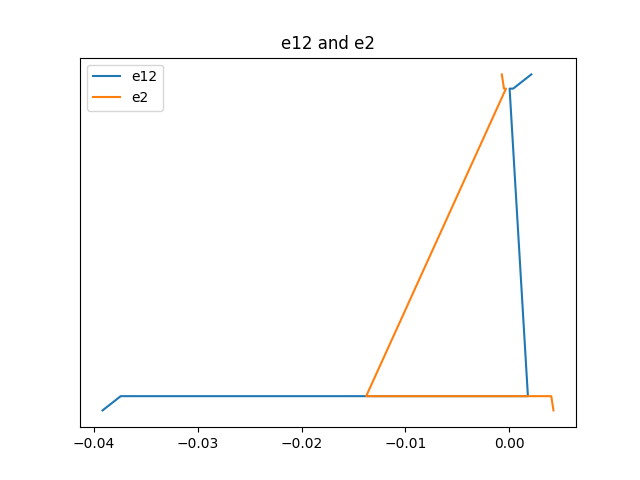
This code uses Matplotlib to generate a custom plot of results e12 and e2.
interfaces = [Spot.BOTTOM, Spot.TOP]
core_scale_factor = 1.0
indices = sampling_point.get_indices(interfaces)
offsets = sampling_point.get_offsets_by_spots(interfaces, core_scale_factor)
e12 = sampling_point.e12[indices]
e2 = sampling_point.e2[indices]

fig, ax1 = plt.subplots()
plt.rcParams["hatch.linewidth"] = 0.2
plt.rcParams["hatch.color"] = "silver"
line = ax1.plot(e12, offsets, label="e12")
line = ax1.plot(e2, offsets, label="e2")
ax1.set_yticks([])
ax1.legend()
ax1.set_title("e12 and e2")
fig.show()
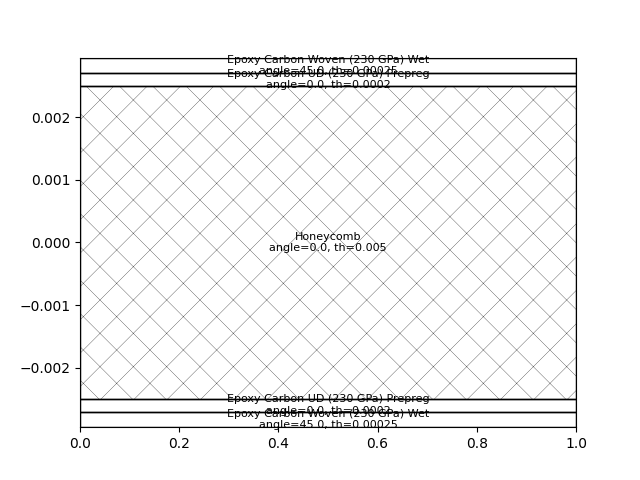
This code plots the lay-up only.
fig2, layup_axes = plt.subplots()
sampling_point.add_ply_sequence_to_plot(layup_axes)
fig2.show()
Sample another element#
You can change the element ID of the sampling point to generate another plot.
sampling_point.element_id = 4
sampling_point_plot = sampling_point.get_result_plots(
    strain_components=[],  # do not plot strains
    core_scale_factor=0.1,
    spots=[Spot.BOTTOM, Spot.TOP],
    show_failure_modes=True,
)
sampling_point_plot.figure.set_figheight(8)
sampling_point_plot.figure.set_figwidth(12)
sampling_point_plot.figure.show()
Total running time of the script: (0 minutes 4.969 seconds)